Appearance
Advanced Playwright Dashboard Testing
Deep dive into running and debugging tests, fixtures, and testing patterns on the LiveOps Dashboard using the Playwright testing framework.
Appearance
Deep dive into running and debugging tests, fixtures, and testing patterns on the LiveOps Dashboard using the Playwright testing framework.
Writing fast and stable tests can be complicated, so we have compiled some of our internal learnings into this page.
The Metaplay SDK has over a hundred built-in Playwright tests that cover most of the patterns you are likely to need for your game-specific tests. In addition to learning from this page, feel free to use our internal tests as a starting point for your own tests. You can find them in the MetaplaySDK/Frontend/DashboardPlaywrightTests folder.
When developing Playwright tests, you have several options for running them, each offering unique advantages for debugging and iteration. This section will guide you through the primary methods, including using the Command Line Interface (CLI) and the Visual Studio Code (VSC) plugin.
At Metaplay, we regularly use the CLI to run tests as a quick batch, while the VSC plugin is useful for debugging and running tests individually. We recommend using both methods to get the most out of your testing workflow.
The CLI provides a straightforward way to run your Playwright tests. Once you've installed the Playwright browsers, you can run your tests using:
pnpm test-e2eThis command executes all end-to-end (e2e) tests in your project. For more advanced usage, such as running specific test files or configuring headless vs. UI mode, refer to the Playwright CLI documentation.
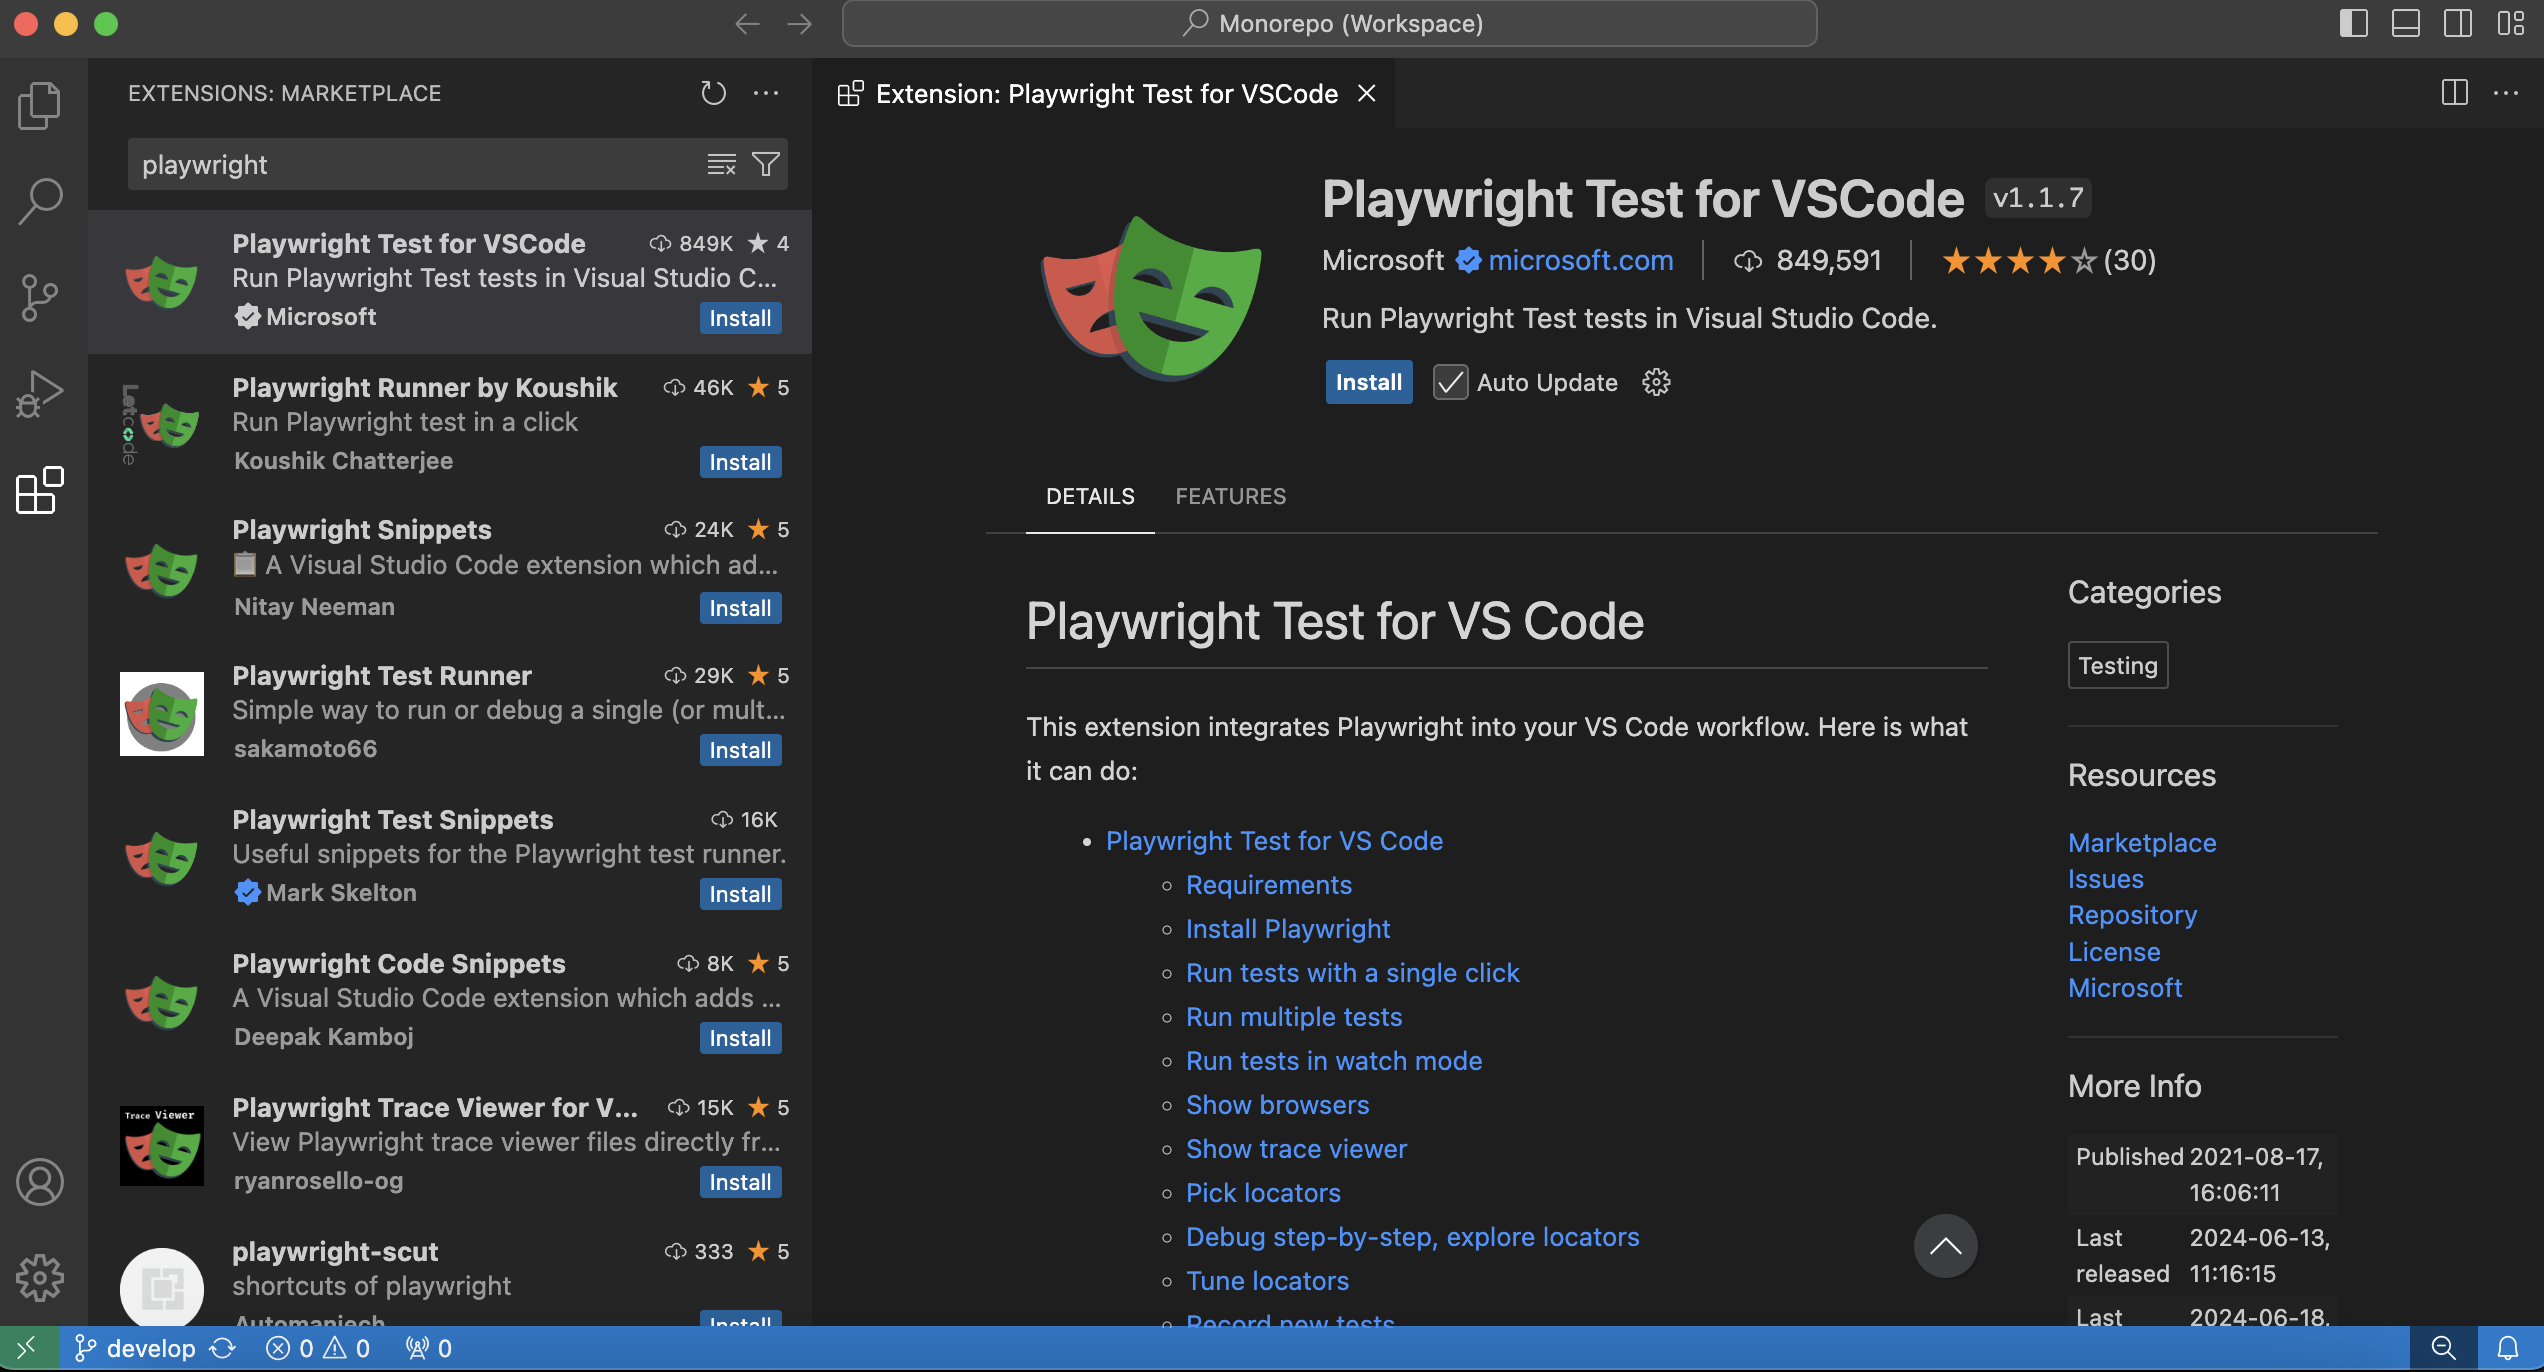
For a more integrated development experience, the Playwright Test for VSCode plugin offers powerful features directly within VSC. Follow these steps to set it up:
Install the Plugin
Ctrl+Shift+X (Win) or Cmd+Shift+X (Mac).
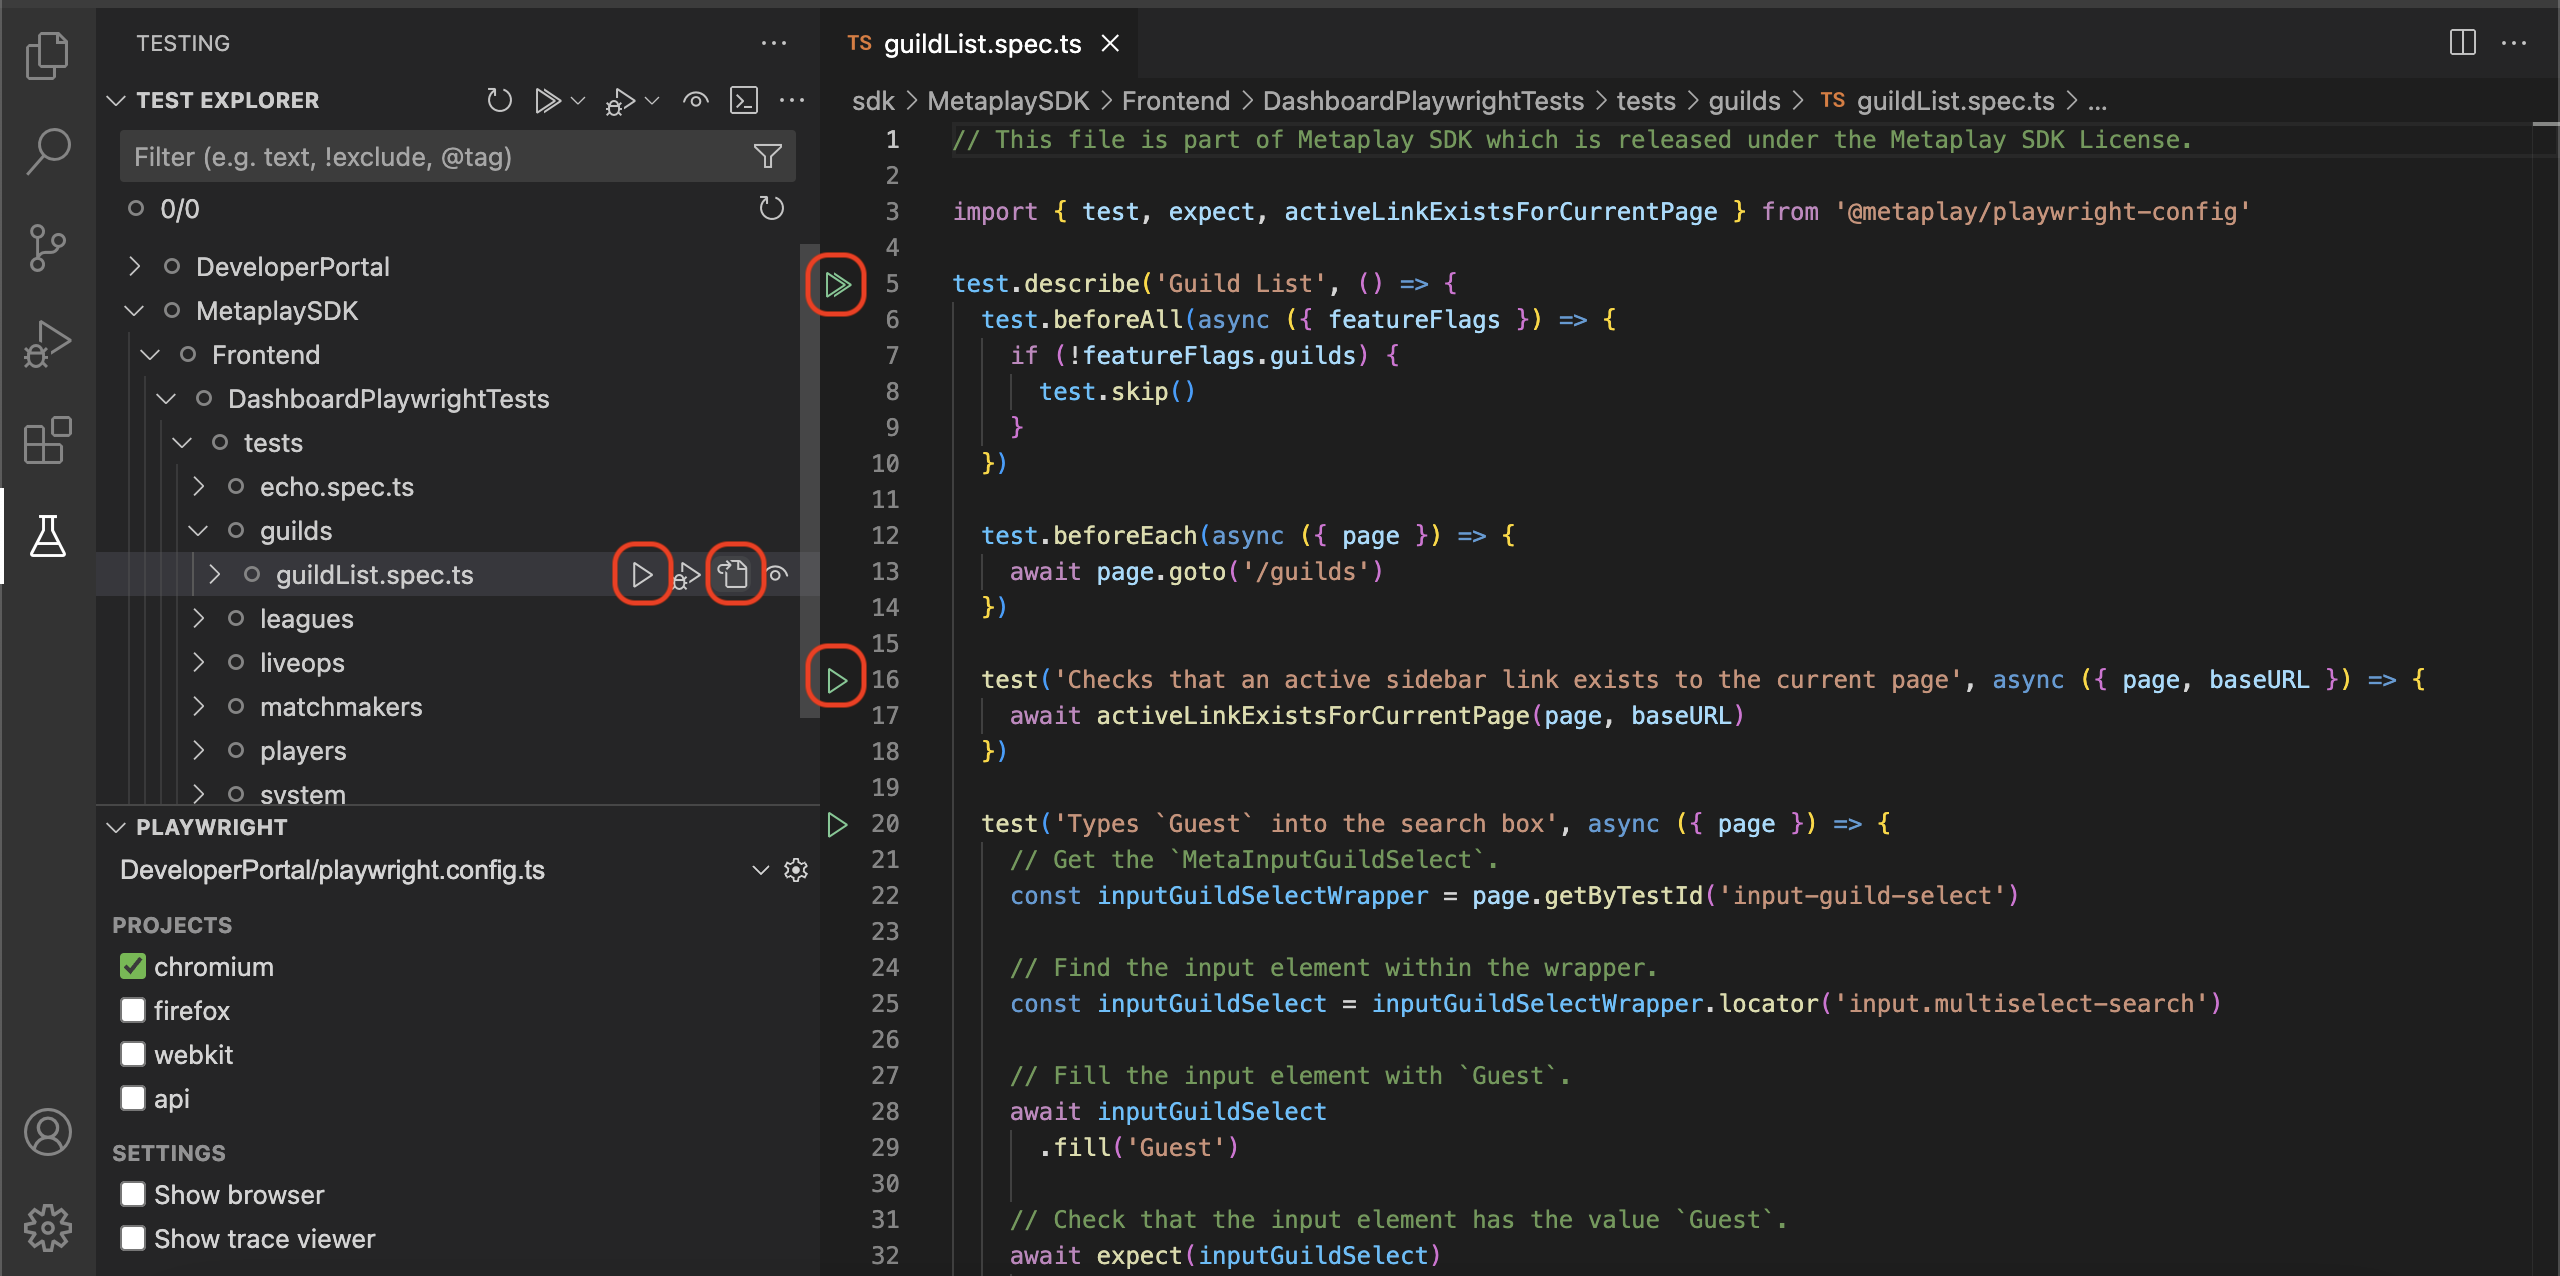
Configure the Plugin
Ctrl+Shift+P (Win) or Cmd+Shift+P (Mac) and type "Test: Toggle Playwright Configs".Run Tests

The VSC plugin also supports debugging tests, allowing you to set breakpoints and step through your test code. For detailed instructions on debugging, refer to the Playwright Test for VSCode documentation.
Writing Playwright tests for the LiveOps Dashboard involves a mix of common patterns and custom actions. This section will guide you through the process of writing your own tests and the common best practices.
To create Playwright tests, add more testName.spec.ts files to your Dashboard/tests/e2e folder.
The most common pattern in the LiveOps Dashboard is to check that a page renders correctly. This involves navigating to a page and checking that the main elements are visible. Let's look at an example from the playerDetails.spec.ts core test.
Navigate to the Page:
page.goto method.Locate the Main Elements:
page.getByTestId to locate elements by their data-testid attribute. This is the most reliable way to maintain tests over time.Assert Element Visibility:
expect function to assert that the elements are visible and contain the expected text.Here's a complete example of a test that checks the rendering of the player details page:
import { test, expect } from '@metaplay/playwright-config';

test.describe('Player Details Rendering', () => {
  test.beforeEach(async ({ page, freshTestPlayer }) => {
    await page.goto(`/players/${freshTestPlayer}`);
  });

  test('Overview and admin tools cards', async ({ page, freshTestPlayer }) => {
    // Get the overview card.
    const overviewCard = page.getByTestId('player-overview-card');

    // Check that the overview card contains the player ID.
    await expect(overviewCard).toContainText(freshTestPlayer);

    // Get the admin actions card.
    const adminActionsCard = page.getByTestId('player-admin-actions-card');

    // Check that the admin actions card is rendered.
    await expect(adminActionsCard).toBeVisible();
  });
});data-testid values with those relevant to your custom pages.expect statements to check the visibility of additional elements on the page.Testing a feature by performing an action and checking the result is a common pattern in the LiveOps Dashboard. This involves interacting with a modal, performing an action, and then verifying the outcome. Let's look at an example from the editName.spec.ts core test.
Navigate to the Page
Open the Modal
page.getByTestId to locate the button that opens the modal and click it.Perform the Action
Assert the Result
expect function to assert that the result of the action is as expected.Here's a complete example of a test that edits a player's name using a modal and checks the result:
import { test, expect } from '@metaplay/playwright-config'

test.describe('Edit Player Name', () => {
  test.beforeEach(async ({ page, freshTestPlayer }) => {
    await page.goto(`/players/${freshTestPlayer}`)
  })

  test('Edits player name', async ({ page }) => {
    // Open the edit name modal.
    await page.getByTestId('action-edit-name-button').click()

    // Define the new name.
    const newName = 'Example Name'

    // Type the new name in the text input field.
    await page.getByTestId('name-input')
      .fill(newName)

    // Click the OK button to save the changes.
    // Please note the custom action `clickMButton` is used here.
    await clickMButton(page.getByTestId('action-edit-name-modal-ok-button'))

    // Check that the player overview card contains the new name.
    const overviewCard = page.getByTestId('player-overview-card')
    await expect(overviewCard).toContainText(newName)
  })
})data-testid values with those relevant to your custom modals.All Playwright tests in the LiveOps Dashboard use fixtures to set up the environment for each test. Fixtures are isolated between tests and can be used to provide context, pages, and other resources to the tests. Let's take a closer look at how fixtures work and how to use them in your tests.
Consider the following sample test:
import { test, expect } from '@metaplay/playwright-config'

test('Trivial example', async ({ page }) => {
  await page.goto('https://example.com')
  const element = await page.getByTestId('example-element')
  await expect(element).toBeVisible()
});
The page fixture is a built-in fixture that acts like an individual tab in a browser. You can use this fixture to navigate to pages, interact with elements, and perform other browser actions. In this example, we first use the page.goto method to navigate to a URL and then use the page.getByTestId method to locate an element by its data-testid attribute.
Depending on the test, you may need additional fixtures to set up the environment. For example, you might need a fixture to create a new player before running the test.
Consider the following sample test:
import { test, expect } from '@metaplay/playwright-config'

test('Request example', async ({ request }) => {
  const response = await request.get('https://example.com')
  const data = await response.json()
  await expect(data).toHaveProperty('exampleProperty')
});
The request fixture is a built-in fixture that allows you to make HTTP requests from your tests. You can use this fixture to interact with external APIs, fetch data, and perform other network-related actions. In this example, we use the request.get method to fetch data from an external API and then assert that the response contains a specific property.
You could use this to fetch data from your game server or other external services to set up the test environment or verify the test outcome.
freshTestPlayer Fixture Metaplay provides several custom fixtures that you can use in your tests. These fixtures provide additional context and resources to your tests, making it easier to write and maintain them. The most useful custom fixture is freshTestPlayer, which provides a new player ID for each test.
import { test, expect } from '@metaplay/playwright-config'

test('Player-specific test', async ({ page, freshTestPlayer }) => {
  await page.goto(`/players/${freshTestPlayer}`)
  const element = await page.getByTestId('player-element')
  await expect(element).toBeVisible()
});
In this example, we use the freshTestPlayer fixture to get a new player ID for each test. We then navigate to the player details page using the player ID and assert that the player element is visible.
Notice how we can keep adding fixtures to the test function parameters as needed. This allows you to access multiple fixtures in a single test, and each fixture is isolated from any other test that may be running in parallel.
Test organizing
featureName.spec.ts where the name should match the component or view being tested.test.describe() to group related tests in a test suite.test.beforeAll() and test.beforeEach() hooks to set up the page for your test suite. Usually, this involves navigating to a page and waiting until it has loaded.Element selection
data-testid attributes in your components to make the right elements easy to discover. This is the most reliable way to maintain tests over time.page.getByTestId() to select elements based on their data-testid attribute.data-testid attributes in our built-in components. You can also check the source code, but just looking at the rendered page is usually faster.MActionModalButton, have a specific pattern for data-testid attributes. You can find more information in the MActionModalButton documentation.Parallelism
freshTestPlayer fixture to create a new player for each test, ensuring that tests are isolated from each other.For a good workflow in writing and debugging Playwright tests, you should use the VSCode plugin. It provides a visual interface for running and debugging tests, making it easier to identify issues and iterate on them.
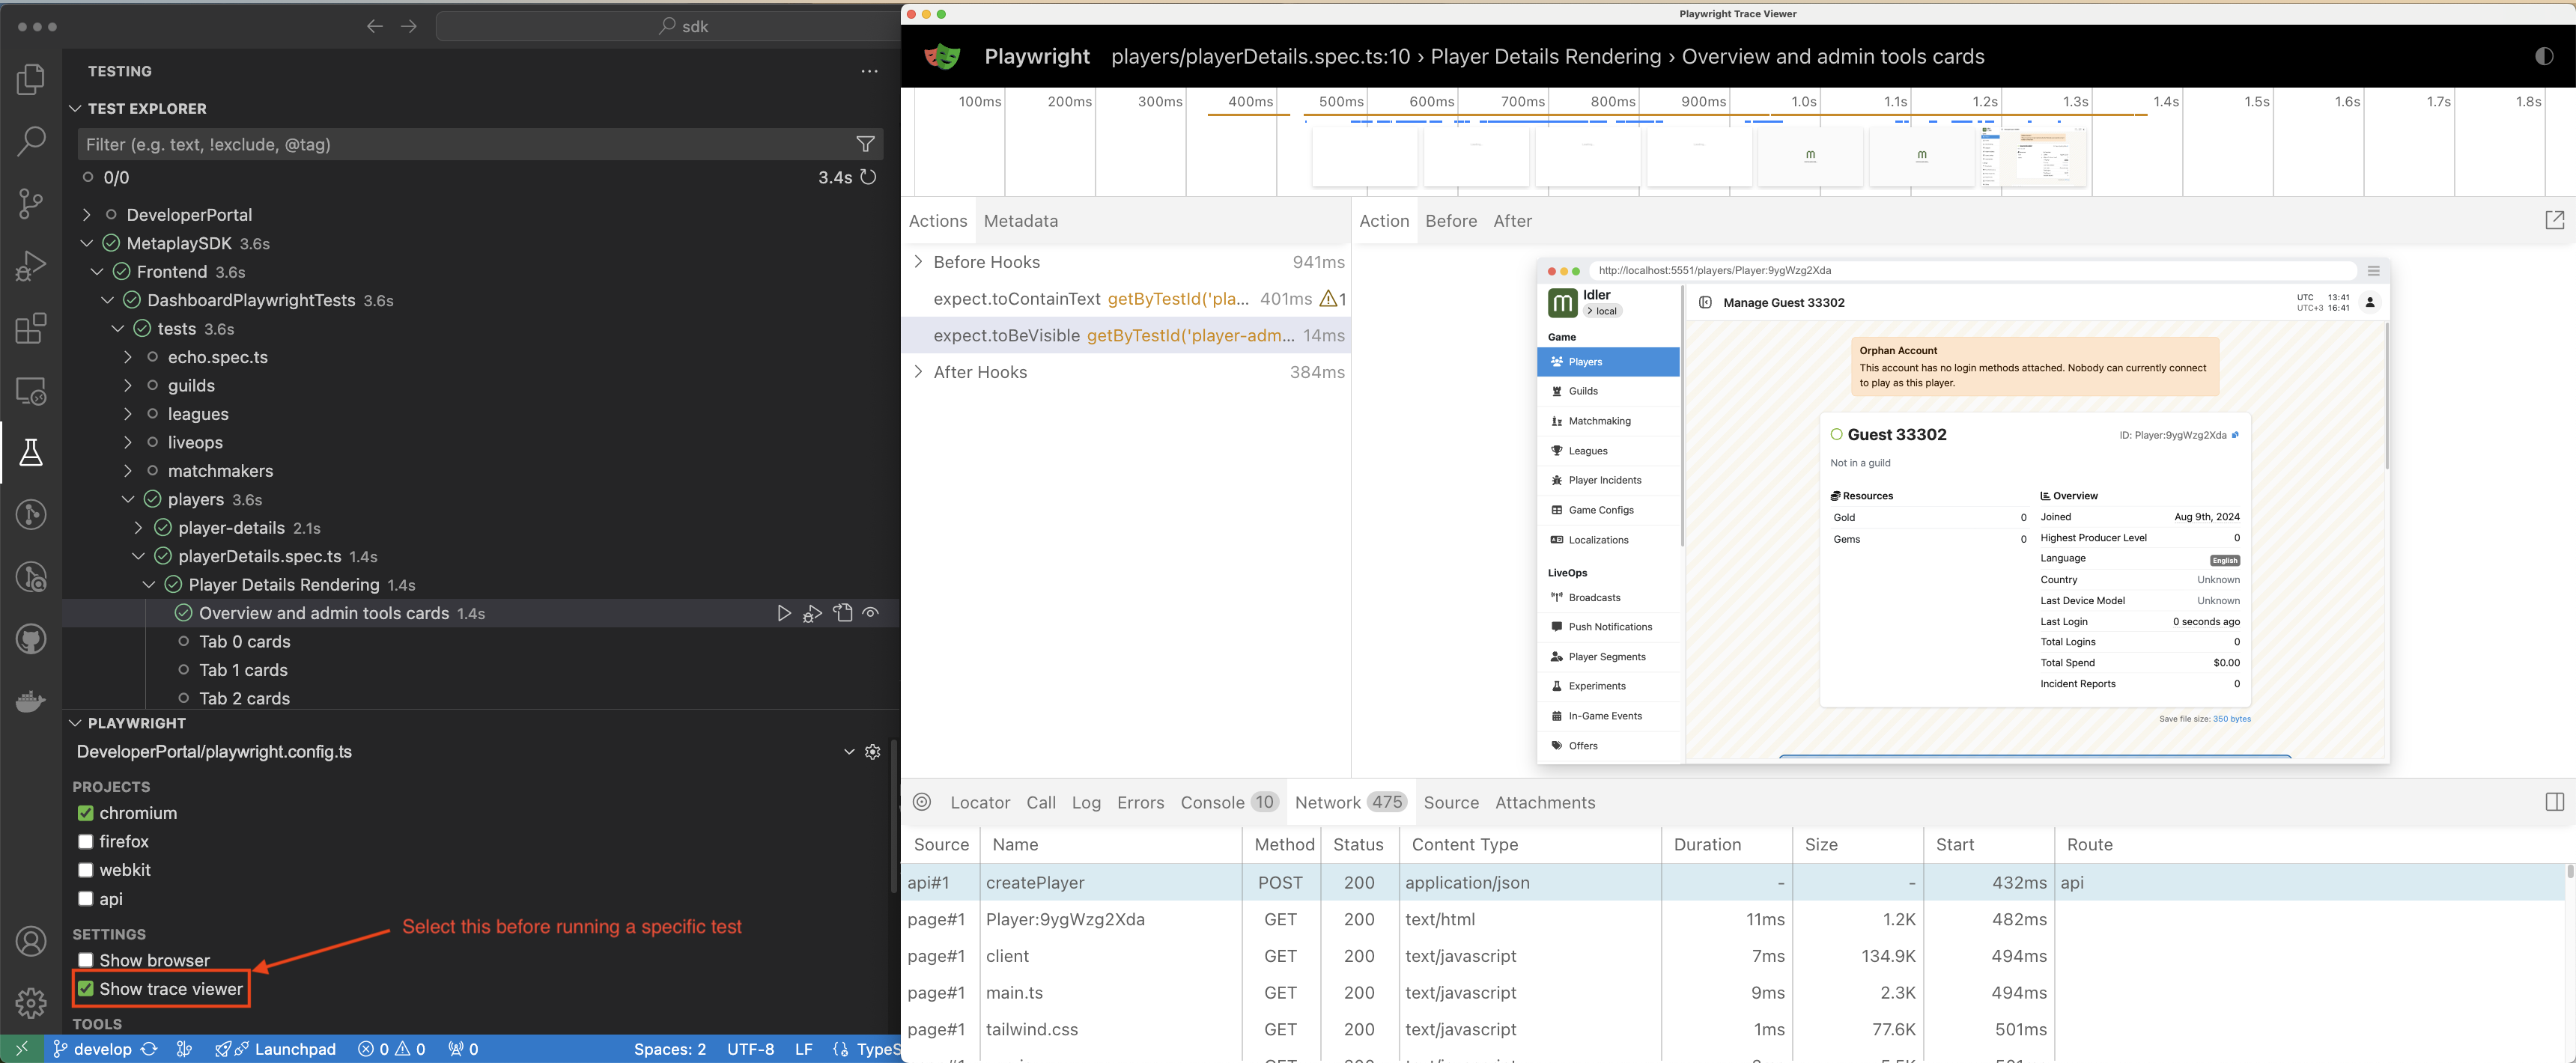
Playwright has a powerful feature called the trace viewer that allows you to visualize the execution of your tests. When you run a test, Playwright generates a trace.zip file that contains detailed information about the test run, including screenshots, console logs, and network requests.
In VSCode, you can automatically open the trace viewer by clicking the trace viewer button in the testing tab. This is the fastest way to debug test runs.

Alternatively, you can upload any trace.zip file to the Playwright trace viewer to view the test execution in a visual format. You can also run the trace viewer locally by running:
pnpx playwright show-trace path/to/trace.zipMost CI systems also support extracting trace files, making it easy to debug test failures in your CI pipeline.
This is a powerful tool to assist in writing new tests or debugging existing ones.
For more in-depth information on running and debugging Playwright tests, consult the official Playwright documentation. It provides comprehensive guides on test execution, configuration, and advanced debugging techniques.