Appearance
Introduction to Game Server Metrics
This page outlines what the game server metrics feature is and what it isn't, and how to access the metrics.
Appearance
This page outlines what the game server metrics feature is and what it isn't, and how to access the metrics.
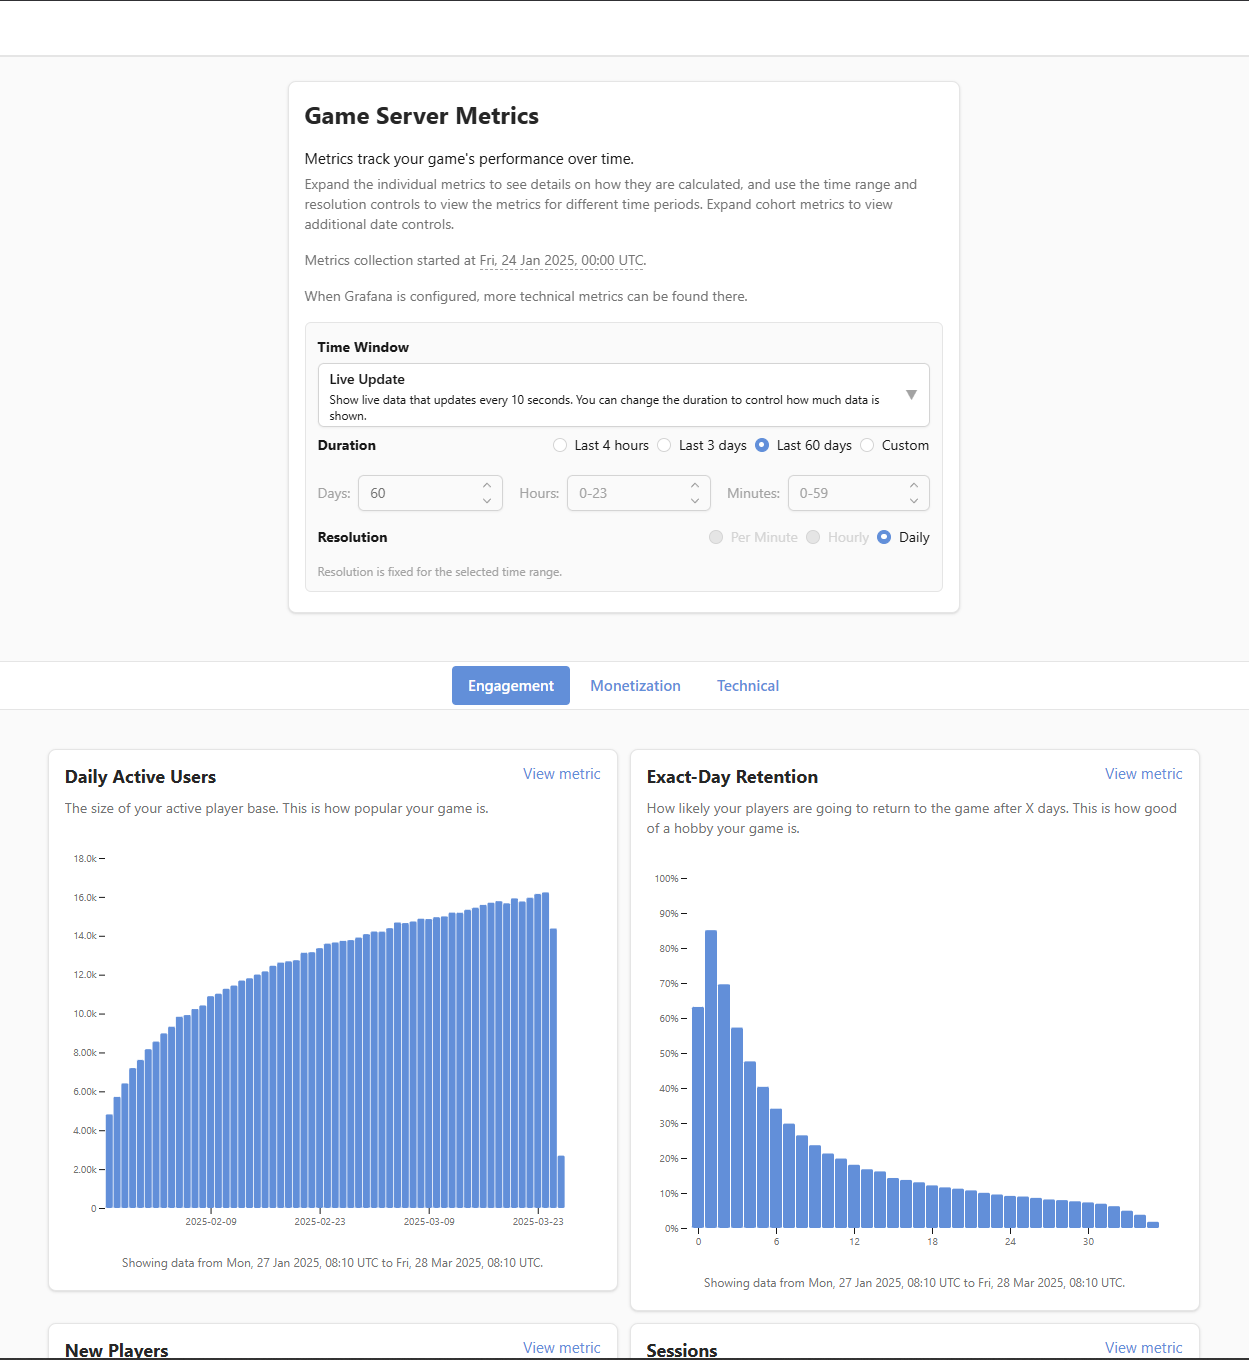
The game server metrics feature collects and presents a visualization of business and technical metrics for easy viewing from the LiveOps Dashboard. Some data is also sent to Metaplay for billing and performance monitoring purposes, most importantly the DAU (Daily Active Users). You can also add your own game-specific metrics to the dashboard, but we recommend that you first read about other tools at your disposal below.
The game server metrics system does not replace dedicated analytics tools such as BigQuery or the technical metrics views visible on Grafana. Specifically, you cannot explore or transform the data in any more ways than the metrics definitions in your server code dictate. Metrics data is pre-aggregated into summary statistics (such as sums, averages, minimums, and maximums) rather than stored as individual events, which optimizes the design for performance and long-term storage efficiency but means that the raw event data cannot be queried or filtered after collection.
You can find the feature in your LiveOps Dashboard under the "Metrics" sidebar link. By default, you'll require the api.metrics.view permission to use it. It's given by default to the Game-Admin and Game-Viewer role. Some metrics, especially revenue related ones, are furthermore limited under the api.metrics.view_sensitive permission, only given to the Game-Admin role by default. Take a look at the Dashboard User Authentication page to learn more about user roles in the dashboard.

You can expand the individual metrics to view a larger version of the chart and to see the implementation description of that metric, describing how the data for that metric is collected. Additionally, for daily cohort metrics, you can access controls to see the data by date, by cohort or as averages. By default, daily cohort metrics show the data as averages.